| Home > Technical Analysis Tutorial > Technical Indicators
|
| Technical Indicators and Signals
|
|
|
Relative Strength Index (RSI)
|
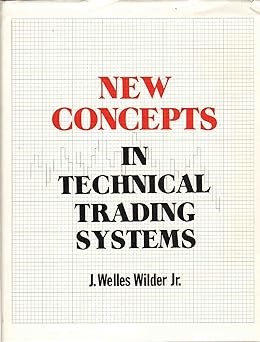
The Relative Strength Index (RSI) is one of the most popular momentum technical indicators. J. Welles Wilder Jr. introduced the index in his book “New Concepts in Trading Systems,” published in 1978. As a momentum indicator, RSI measures the strength of the price movement. As a stochastic oscillator, the relative strength index displays the strength or weakness in the issue’s price movement on a scale of 0 to 100. After a strong up wave, the relative strength index moves up and moves lower during a downtrend. The RSI level above 70 is considered an overbought area, while a level below 30 indicates an oversold condition. Since the market usually does not move in one direction for a long time, an oversold or overbought RSI suggests that the probability of price movement pausing or retreating is higher. The RSI works well and gives valuable signals when the market trades in a range. In a strong trending market, the relative strength index may stay in an overbought or oversold area for a long time, giving false signals.
Another popular technique related to RSI is called bullish and bearish divergence. The RSI level indicates the strength of the current price trend. It moves closer to 100 in a strong uptrend and to level 0 in a strong downtrend. If, for example, a price uptrend became weaker, the relative strength index level moved down indicating a weakening trend while the price is still rising. The bearish divergence appears when the price makes a higher high, but the RSI level does not make a higher high. Similarly, bullish divergence appears when during a strong downtrend, the RSI level moves up while the price reaches a lower low. The relative strength index divergence indicates weakness in the current trend and is considered a warning signal of an upcoming trend reversal. You can read more about bullish and bearish divergence here.
|
Relative Strength Index (RSI) Trading Technique
|
There are many different trading strategies that utilize the relative strength index. Most techniques perform better in some specific market conditions but show poorer results in different markets. One of the simplest RSI-based trading strategies generates a buy signal when the RSI crosses above the oversold area and a sell signal when the RSI crosses below the overbought area.
The Kimberly-Clark Corporation (KMB) chart below shows the weekly relative strength index between September 2021 and September 2023. The stock price is mostly trading in a range between $108 and $146.
|
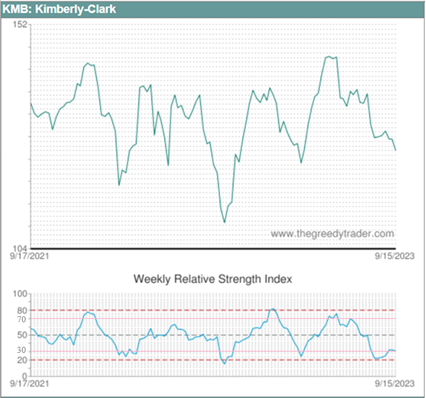 |
The trading technique that uses the RSI overbought and oversold levels as sell and buy signals works better in a trading market when the stock price moves in a narrow range. The strategy that generates a buy signal when the relative strength index moves above 30 and a sell signal when it moves below 70 would produce the following trades:
This strategy works well in a trading market when the price fluctuates in a range, but when the price is trending up, the relative strength index usually stays mostly above level 50, generating many false sell signals with very rare buy signals. In this scenario, traders usually miss an excellent opportunity to make a profit in the rising price trend. In a falling market, this strategy often loses money since the RSI level usually stays below level 50, generating many false buy signals.
Some traders adjust the relative strength index overbought and oversold area according to the market trend. In a rising market, they may consider an RSI level below 50 as an oversold condition and an RSI crossing above this level as a buy signal. In a rising market, the RSI overbought area might be moved to the 80 or 90 level. Stocks with RSI above this level are often called strongly overbought, and RSI crosses below the strongly overbought area are considered as a sell signal. Similarly, traders often use the RSI cross below the 50-level signal in a falling market as a sell signal. The RSI below the 20 or 10 level is strongly oversold, and crossing above the strongly oversold level is considered a buying signal.
The Block H&R (HRB) price chart below is forming a rising channel. During a rising channel pattern, the relative strength index usually spends most of the time in an oversold or strongly oversold area and doesn’t go to an overbought area. In this example, if the trader waits for RSI to cross above the oversold level, they will miss an excellent buying opportunity.
|
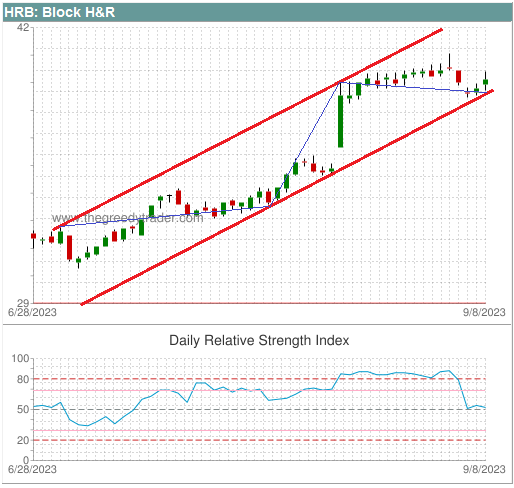 |
Using the RSI crossing above the 50 level as a buy signal works better in this example. The table below shows the trades produced by this strategy if we use RSI crossing below the 70 level as a sell signal. This RSI trading technique does not present substantial gain in this scenario.
For sharp rising trends, using RSI crossing below the 80 level as a sell signal works much better. The following table shows the buy and sell signals produced by this strategy. It generated a 19.51% gain in 35 business days.
|
Relative Strength Index (RSI) Stock Scanner
|
The Oscillators Stock Scanner shows the number of daily and weekly overbought, strongly overbought, oversold, and strongly oversold stocks/ETFs for RSI, Lane’s Stochastic, and Williams’ Percentage Range.
|
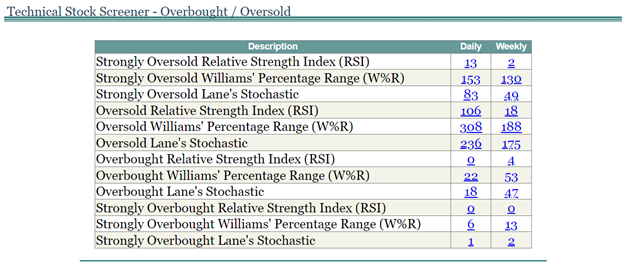 |
Users can click on the link to see a list of corresponding stocks. The Oscillator columns present daily and weekly oscillator icons that indicate the oscillator’s oversold/overbought level. The three bars on the icon from left to right represent the Relative Strength Index (RSI), Williams %R Range, and Lane’s Stochastic.
 - indicates a strongly overbought stochastic oscillator. - indicates a strongly overbought stochastic oscillator. - indicates an overbought stochastic oscillator. - indicates an overbought stochastic oscillator. - indicates a normal oversold/overbought level. - indicates a normal oversold/overbought level. - indicates an oversold stochastic oscillator. - indicates an oversold stochastic oscillator. - indicates a strongly oversold stochastic oscillator. - indicates a strongly oversold stochastic oscillator.
A red border around the icon  indicates a bearish divergence and a green border indicates a bearish divergence and a green border  indicates a bullish divergence. Users can move the cursor over the icon to see the oscillator’s values and a list of formed divergences for each stock. indicates a bullish divergence. Users can move the cursor over the icon to see the oscillator’s values and a list of formed divergences for each stock.
|
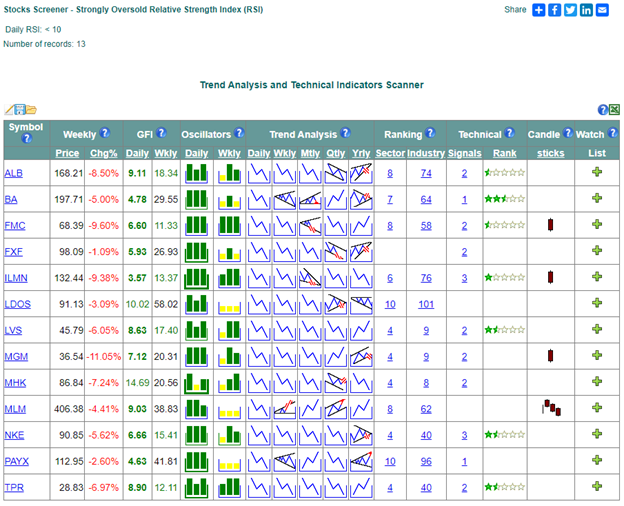 |
By clicking on the icon, users will open the Technical Indicators Details page that displays a price chart with a stochastic oscillator graph and details, including values, overbought/oversold levels, and bullish/bearish divergence statuses for each indicator.
The Technical FilterTechnical Filter page allows users to select more complex search criteria combining RSI level range in different time frames or several other technical criteria, including chart patterns and/or trend-following technical indicators.
|
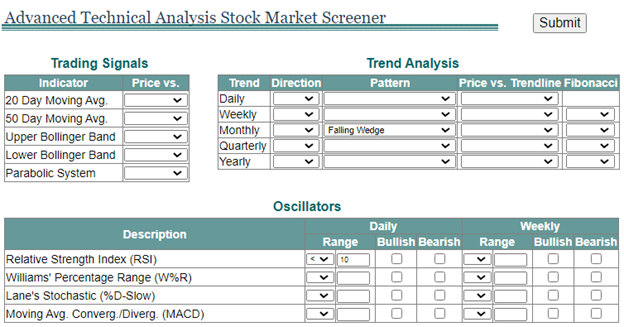 |
The example above shows the selection of RSI levels below 10 with monthly falling wage pattern criteria. When users submit this request, the next page will show the list of stocks that match the selected criteria.
|
 |


|