| Home > Technical Analysis Tutorial > Chart Patterns
|
| Chart Patterns
|
|
|
Ascending Triangle Pattern
|
An ascending triangle is one of the most popular technical analysis chart patterns. In an ascending triangle pattern, the price moves between two converging trendlines: a rising support line and a horizontal resistance line. Traders have been using the ascending triangle pattern since at least the beginning of the 20th century. The first book that described the ascending triangle pattern recognition and trading techniques was “Technical Analysis of Stock Trends”, published in 1941 by Robert D. Edwards and John Magee. In 1972, Thomas Bulkowski classified the ascending triangle as a continuation pattern in his book “Encyclopedia of Chart Patterns”. According to his research, the ascending triangle breaks out upward 70% of the time and reaches its price target 63% of the time.
It is essential to identify the pattern formation as early as possible. The ascending triangle usually appears in a rising trend and is considered a continuation pattern. In a bearish trend, an ascending triangle pattern often signals a reversal. To identify this pattern, traders look for at least two consecutive highs that form a resistance line and at least two consecutive lows that form a support line. A resistance line based on only two consecutive highs may not be reliable. A double top pattern also has a horizontal resistance line formed by two consecutive highs. However, a double top pattern is a reversal pattern, whereas an ascending triangle pattern is usually a continuation pattern. Thomas Bulkowski (https://thepatternsite.com/at.html#AT00) states that “Price must touch one trendline at least three times, the other at least twice, forming distinct valleys and peaks.” The pattern becomes more reliable when more highs and lows touch the support and resistance trend lines.
|
How to Find Ascending Triangles with a Stock Screener
|
Our technical analysis Stock Screener provides tools to help users find stocks that form an ascending triangle pattern and satisfy their additional criteria.
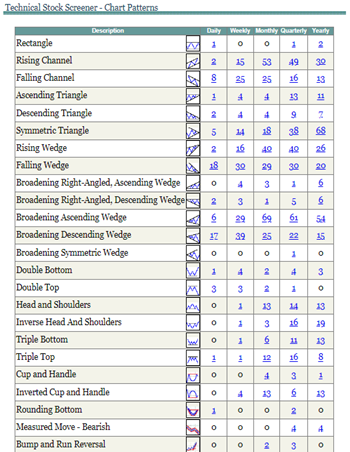
Technical Stock Screener – Chart Patterns screen displays the number of patterns in various time frames: daily, weekly, monthly, quarterly, and yearly. Each number is a link to a list of stocks that have the selected patterns. In the image below, for example, the Screener shows that there is one recognized ascending triangle pattern in the daily time frame, four in the weekly and monthly time frames, thirteen in the quarterly time frame, and eleven in the yearly time frame.
|
 |
|
To see a list of stocks with an ascending triangle pattern in a quarterly time frame, the user clicks on the number thirteen under the Quarterly column. The image below shows the next Stock Screener page with the list of thirteen stocks/ETFs. The Trend Analysis columns display icons of the chart patterns. The following image shows the parameters for the ascending triangle pattern on the quarterly time frame of TXN. The tooltips show the pattern name, pattern low/high, current price, and support resistance level when the user moves the cursor over the pattern icon.
|
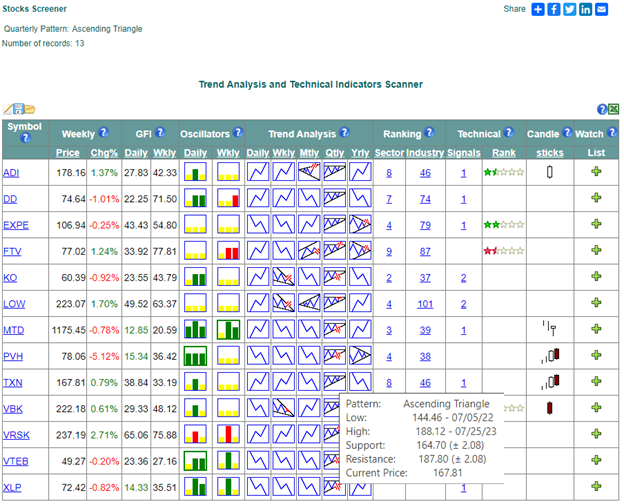 |
The Trend Analysis Quarterly (Qtly) column displays the icons of the ascending triangle patterns. The icon indicates the status of the pattern.
 - A valid ascending triangle pattern with the price between the support and resistance lines. - A valid ascending triangle pattern with the price between the support and resistance lines. - An ascending triangle pattern with a broken resistance line. - An ascending triangle pattern with a broken resistance line. - An ascending triangle pattern with the price near the resistance line. - An ascending triangle pattern with the price near the resistance line. - An ascending triangle pattern with the price near the support line. - An ascending triangle pattern with the price near the support line. - An ascending triangle pattern with a broken support line. - An ascending triangle pattern with a broken support line.
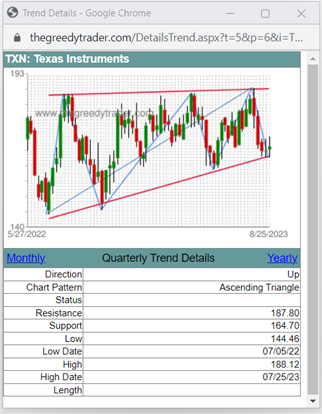
Users can click on the trend pattern icon to see the Trend Details pop-up screen that displays the stock price chart with the pattern’s support and resistance lines and subwaves.
|
 |
Advanced Stock Screener is a tool that allows users to find a list of stocks/ETFs that have formed ascending triangle patterns with additional technical search criteria. Users can select the following criteria:
- The trend direction and the pattern name in one or more time frames.
- The pattern status: price near support or resistance level, broken support or resistance, or price between support and resistance lines.
- If the price is near a Fibonacci retracement level
- If the price is above, below, or near a moving average, a Bollinger Band, or the Parabolic System
- Specify the range and/or bullish and bearish divergence for the Relative Strength Index (RSI), Williams’ Percentage Range (W%R), Lane’s Stochastic, and/or MACD in daily and weekly time frames.
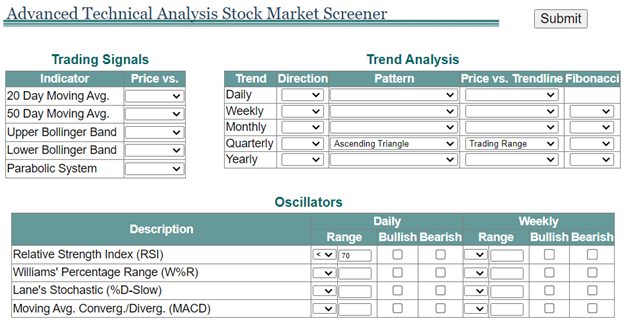
The image below shows the selection of an ascending triangle pattern in a quarterly time frame with the price between the support and resistance levels. In addition, the Relative Strength Index is selected below 70 to exclude the overbought stocks.
|
 |
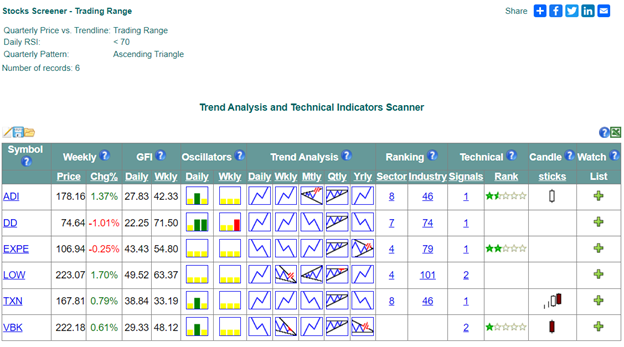
When all the criteria are selected, the user can click on the Submit button to see the Stock Screener page with the list of stocks/ETFs that match the specified criteria. The information in the left upper corner of the screen shows the list of search criteria. The list of stocks presented by the Advanced Stock Screener is similar to, but shorter than, the list presented by the Technical Stock Screener, because the search criteria are more restrictive.
|
 |
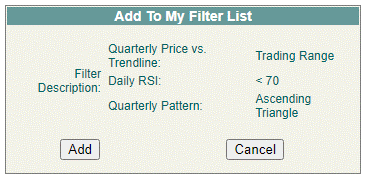
Above the Symbol grid column, there is a  “Save Filter” icon. Users can click the “Save Filter” icon to save the selected criteria in a personal list of filters for future use. The selected criteria will appear on the “Add to My Filter List” page. The user can save the selection and view the list of personal saved Stock Screener filters by clicking the Add button “Save Filter” icon. Users can click the “Save Filter” icon to save the selected criteria in a personal list of filters for future use. The selected criteria will appear on the “Add to My Filter List” page. The user can save the selection and view the list of personal saved Stock Screener filters by clicking the Add button
|
 |
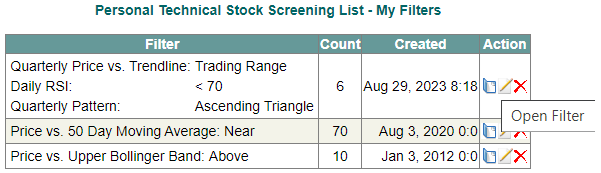 |
To open the personal saved filters, users can select the “My Filter” submenu under the Analysis menu or click here. Then, they can select the  "Open Filter" icon in the action column to go back to the Stock Screener page and see the current list of stocks/ETFs that match the filter criteria. "Open Filter" icon in the action column to go back to the Stock Screener page and see the current list of stocks/ETFs that match the filter criteria.
|
Trading the Ascending Triangle Pattern
|
An ascending triangle is a continuation pattern that usually appears in a rising trend. In a downtrend, an ascending triangle is less common and may signal a reversal pattern. Traders usually open a long position (buy security) when the stock price moves above the resistance line. This means that the resistance line has become a new support line and the price often retests that level. It is important to place a stop-loss order to minimize possible losses if the market moves in the opposite direction. A stop-loss order is an instruction to sell a security when it reaches a certain price. The price where the chart recently touched the support line can be used as a stop-loss level. To calculate a potential price target, traders add the distance between the breakout point and the high of the triangle to the breakout price. This gives an estimate of how far the price could rise after breaking out of the triangle. Of course, there is no guarantee that the price will reach the target, but it provides a reference point for the trader to estimate a potential reward.
When the price drops below the support line, traders sell the security (open a short position). The support line becomes a new resistance line and the original resistance line can be used as a stop-loss level. To estimate a potential price target, traders subtract the distance between the breakout point and the high of the triangle from the breakout price. This gives an estimate of how far the price could fall after breaking out of the triangle.
|
Ascending Triangle Examples
|
The image below shows an example of the ascending triangle pattern formed on the quarterly price chart of Fortive Corporation (FTV). The horizontal resistance line of the ascending triangle is marked by three consecutive price highs at approximately $67.25 level. A rising support line is formed by three consecutive lows. The example of Fortive Corporation's (FTV) ascending triangle has several noticeable characteristics that may appear in the pattern and can help traders and investors better understand the pattern formation and achieve better trading results:
- Breakout occurred with a price gap up.
- Momentum technical indicators showed bearish divergence.
- The resistance line of the smaller time frame chart pattern crossed the resistance line of the larger time frame chart pattern at the breakout point.
The stock experienced a triangle breakout on June 2, 2023. It opened with a price gap up at $66.05, which was higher than the previous day’s close of $65.47. The gap remained open and the price broke the resistance level by reaching the day’s high of $67.56. It closed at a price of $67.27.
|
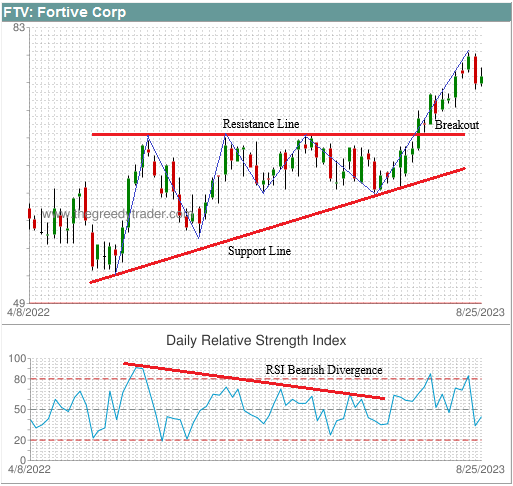 |
The chart of Fortive Corporation (FTV) above shows a Relative Strength Index (RSI) bearish divergence during the formation of an ascending triangle. An ascending triangle is a bullish pattern, but it often has a bearish divergence. When the price reaches the resistance level for the first time, momentum technical indicators like the Relative Strength Index (RSI) or Lane’s Stochastic are usually in an overbought or strongly overbought area. A strongly overbought indicator is a bearish signal that occurs after a significant uptrend. Some traders sell stocks and take a profit when the momentum indicators become bearish, causing the price to retreat. The price chart then enters the consolidation phase, where the price fluctuates between the support and resistance lines. Price rises more slowly during the pattern formation than at the beginning, and momentum technical indicators decline from the overbought area and form a bearish divergence while the ascending triangle pattern is forming.
Another interesting observation of the Fortive Corporation (FTV) ascending triangle example is that it formed a Symmetric Triangle pattern on the yearly chart. The price broke out when the yearly symmetric triangle resistance line intersected with the quarterly ascending triangle resistance line.
|
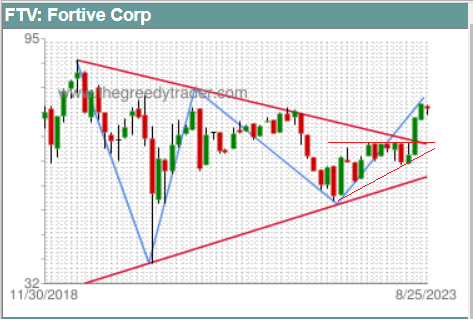 |
The price breakout is more reliable when it is confirmed by chart patterns in different time frames.
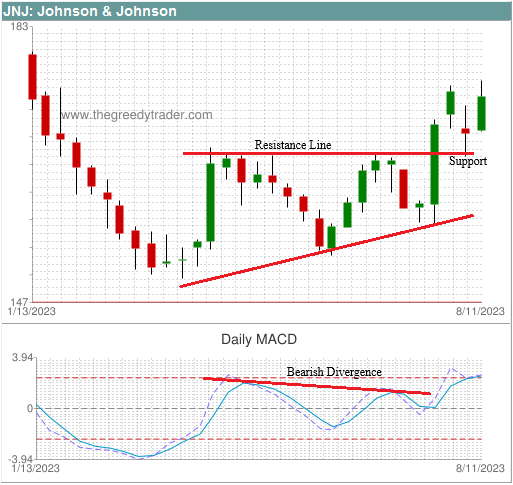
The following chart illustrates an example of the ascending triangle as a reversal pattern in a downtrend that formed on the Johnson & Johnson (JNJ) price chart. As previously mentioned, when a breakout occurs, the former resistance line becomes a new support line. The resistance level of the pattern was broken on July 20, 2023. JNJ stock opened at $161.94 with a gap up after closing at $158.74 the previous day and made a 6% gain in one day, closing at $168.38. After retesting the former resistance level, JNJ stock price rebounded and reached a new high of $175.36, but this new high did not last. The price dropped as it met a resistance line from a longer time frame pattern.
|
 |
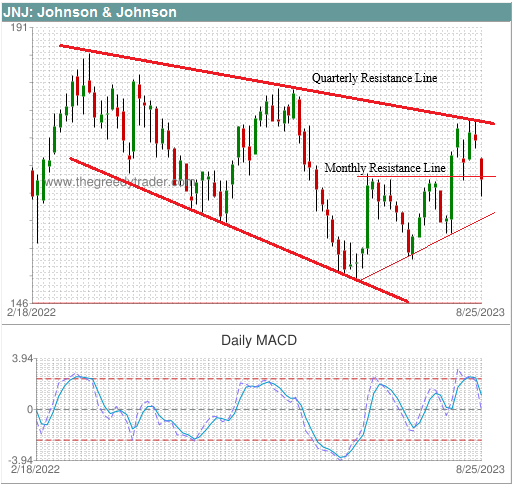
The chart below illustrates the quarterly trend of Johnson & Johnson (JNJ) that started on April 25, 2023 and formed a Broadening Descending Wedge pattern. Unlike the previous example with Fortive Corporation (FTV), the resistance line of the monthly ascending triangle pattern for Johnson & Johnson (JNJ) was much lower than the resistance line of the quarterly Broadening Descending Wedge pattern. By the time the price reached the quarterly resistance, most of the momentum technical indicators were strongly overbought. Traders started taking profit from the recent rally, and the price fell sharply below even the former resistance line of the ascending triangle, which was supposed to serve as a new support line.
|
 |


|