Symmetric Triangle Chart Pattern Analysis - Symmetric Triangle Pattern. |
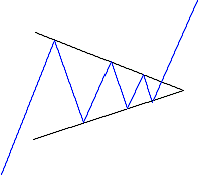 A symmetric
triangle pattern represents the area of indecision where the movement direction is
questioned. Chart Pattern Analysis usually considers a symmetric triangle chart pattern as a continuation
formation which resolves in the direction of a larger trend, but it may also mark the
trend reversal. Volume diminishes during the formation and explodes at the
breakout. After breakout (similar to rectangle), support may turn into potential
resistance and vice versa. A symmetric
triangle pattern represents the area of indecision where the movement direction is
questioned. Chart Pattern Analysis usually considers a symmetric triangle chart pattern as a continuation
formation which resolves in the direction of a larger trend, but it may also mark the
trend reversal. Volume diminishes during the formation and explodes at the
breakout. After breakout (similar to rectangle), support may turn into potential
resistance and vice versa.
Tips:
# 1 As a continuation pattern, the symmetric triangle usually appears within
a young trend characterized by neutral long-term indicators and
overbought/oversold short-term indicators. The symmetric triangle resets short-term
indicators to neutral and then continues movement in parent's direction.
# 2 As a reversal formation, the symmetric triangle chart pattern appears in a mature trend
characterized by overbought/oversold long-term and short-term indicators. This
situation usually generates divergence on long-term indicators. For the best results, the symmetric triangle pattern should be considered together with other chart pattern analysis, technical analysis signals and technical trading techniques.
Estimated Target: the main trend support/resistance line. |
|