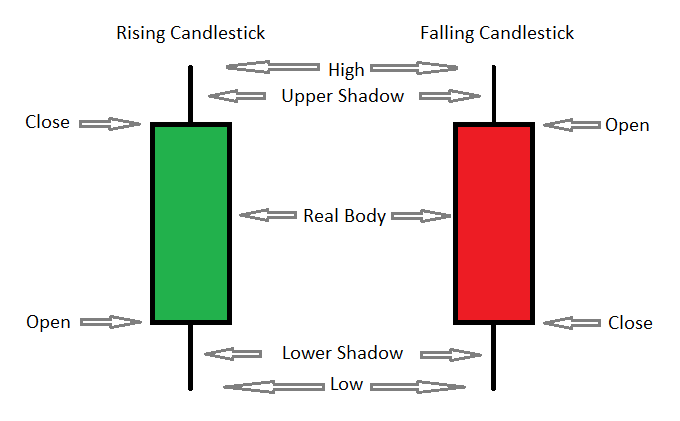
The Candlestick Chart Patterns were created in Japan in the 1700s by rice merchant Munehisa Honma. Candlestick formations provide a visual representation of the market open, high, low and close prices for each time period (unit of time) they display. They consist of three sections: Upper Shadow, Real Body, and Lower Shadow (sometimes shadows are called tails or wicks).
The Candlestick Real Body is a thicker section of the candlestick between the open and close prices. If the close price is higher than the open price, the bottom of the body represents the open price and the top of the body represents the close price. In this case, the candlestick body is usually filled with green, blue, or white. If the close price is lower than the open price, the bottom of the body represents the close price and the top of the body represents the open price. In this case, the candlestick body is usually filled with red or black. The thin line below the candlestick body is called the Lower Shadow. The lowest point of the lower Shadow represents the period low price. The thin line above the candlestick body is called the Upper Shadow. The top point of the Upper Shadow represents the period high price.
Many traders prefer Candlestick charts and consider them easier to interpret than the traditional Bar Charts, which show the same information, just in a different way. Each candlestick provides a clear visual picture of price movement between market open and close, as well as lows and highs.
Each element of the candlestick reveals a different aspect of the current trading behavior and the predominant market sentiment.
The size of the candlestick body shows the strength of buyers or sellers. When the size of the bodies grows over time periods, then the price movement accelerates and a trend is intensified. If the size of the body decreases, the prevailing market forces are losing control and trends are coming to an end. A sudden shift from long rising candlesticks to long falling candlesticks indicates a sudden change in market sentiments and often marks trend reversal.
The length of the shadows represents the level of market uncertainty and price volatility. Long shadows are a sign of instability, when the fight between buyers and sellers is intensifying. Strong, stable trends usually have candlesticks with short shadows, which indicate that one force has complete control over the market direction. The ratio between the length of the shadow and body is an important indicator of trend stability.
A large lower shadow shows that strong sellers were trying to bring the price lower, but their efforts were short-lived and the price moved back. The size of the upper shadow shows how far buyers can temporary move the price up until the sellers have pushed it back down.