| Home > Technical Analysis Tutorial > Technical Indicators
|
| Technical Indicators and Signals
|
|
|
Bullish and Bearish Divergence
|
Bullish and bearish divergences are important technical signals that are closely related to stochastic oscillators and momentum technical indicators, such as the Relative Strength Index (RSI), Williams %R Range, Lane’s Stochastic, and Moving Average Convergence/Divergence (MACD). Usually, there is a correlation between the market price and momentum technical indicators, so a rising price leads to higher momentum indicators and a falling price leads to lower indicators. Divergences appear when the correlation between the market price and technical indicators breaks down.
Stochastic oscillators and momentum indicators are lagging technical signals that appear with a delay after the price movement has already started. Bullish and bearish divergences signal that the current trend is weakening and slowing down. They serve as leading signals that predict an upcoming trend reversal.
|
Divergence Classes
|
There are several different types of bullish and bearish divergences. The Class A - strong bearish divergence occurs when the market price makes a higher high but the technical indicator makes a lower high, and the Class A - strong bullish divergence occurs when the price makes a lower low while the technical indicator makes a higher low.
The Class B – medium bearish divergence occurs when the new price makes a higher high while the technical indicator reaches the same level as the previous high, and the Class B – medium bullish divergence occurs when the price low is at the same level as a previous low while the technical indicator makes a higher low. The Class C - weak bearish divergence occurs when the new price makes a higher high while the technical indicator reaches the same new low as the previous low, and the Class C - weak bullish divergence occurs when the price makes a lower low while the technical indicator reaches the same new high as the previous high.
Class A divergence is the most significant type of divergence. It is considered a strong signal of an upcoming trend reversal. Class B and C divergences are considered weak and not very reliable types.
Class A, B, and C divergences are called regular or classic divergences and are considered reversal signals. In contrast to the regular divergence, there is a type of divergence called a hidden divergence. A hidden bullish divergence occurs when in a rising trend, the price makes a higher low while the technical indicator makes a lower low. A hidden bearish divergence occurs when in a falling trend, the price makes a lower high while the technical indicator makes a higher high. Unlike a regular divergence, a hidden divergence is considered a continuation signal.
|
How to Find Bullish and Bearish Divergences Using Stock Screener
|
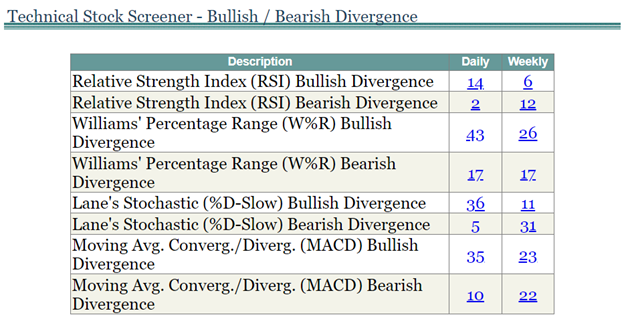
There are several ways to find a list of stocks/ETFs with divergence using our Technical Stock Screener – Bullish / Bearish Divergence page (see image below). This page shows the number of stocks/ETFs that have formed bullish or bearish divergence for stochastic oscillators and momentum technical indicators, including the Relative Strength Index (RSI), Williams %R Range, Lane’s Stochastic, and MACD in daily and weekly time frames.
|
|
The numbers on the screen are links to the Technical Indicators Scanner shown below. The Scanner page displays a list of stocks/ETFs that match the selected criteria, as shown on the top left corner of the page. The example below shows a list of stocks with weekly RSI Bearish Divergence. The color and size of the vertical bar of the icons in the Oscillators column of the grid indicate the oscillator’s oversold/overbought level. The three bars on the icon from left to right represent the Relative Strength Index (RSI), Williams %R Range, and Lane’s Stochastic.
 - indicates a strongly overbought stochastic oscillator. - indicates a strongly overbought stochastic oscillator. - indicates an overbought stochastic oscillator. - indicates an overbought stochastic oscillator. - indicates a normal oversold/overbought level. - indicates a normal oversold/overbought level. - indicates an oversold stochastic oscillator. - indicates an oversold stochastic oscillator. - indicates a strongly oversold stochastic oscillator. - indicates a strongly oversold stochastic oscillator.
A red border around the icon  indicates a bearish divergence, and a green border indicates a bearish divergence, and a green border  indicates a bullish divergence. Users can move the cursor over the icon to see the oscillator’s values and a list of formed divergences for each stock. indicates a bullish divergence. Users can move the cursor over the icon to see the oscillator’s values and a list of formed divergences for each stock.
|
|
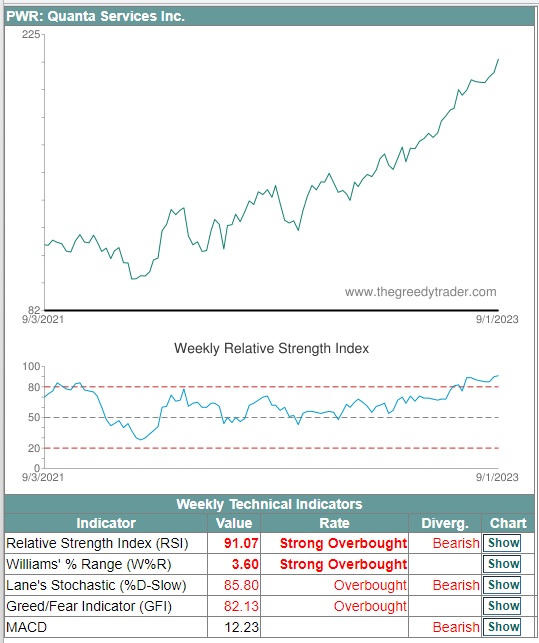
By clicking on the icon, users will open the Technical Indicators Details page that displays a price chart with a stochastic oscillator graph and details, including values, overbought/oversold levels, and bullish/bearish divergence statuses for each indicator
|
|
How to Trade Bullish and Bearish Divergences
|
First of all, divergence is a warning signal that the current trend is losing strength and there is a possibility of a trend reversal. However, it is not a guarantee, just an indication. The second characteristic that makes divergence different from other trading signals is that divergence does not tell exactly when to open a trade or what the price target is. As with many technical signals, divergence is more reliable if confirmed by other technical indicators or by divergence in several different time frames.
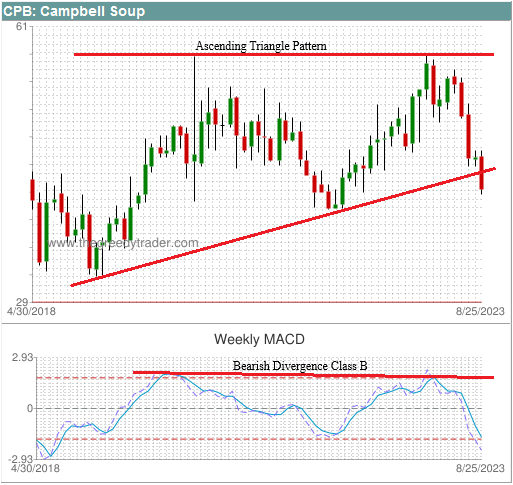
Bullish and bearish divergences often appear together with chart patterns. For example, a Falling Wedge pattern is usually accompanied by a bullish divergence, while a bearish divergence appears with a Rising Wedge pattern. A bearish divergence Class B often forms with an Ascending Triangle or Double Top pattern, while a Descending Triangle or Double Bottom pattern frequently accompanies a Class B bullish divergence. It is important to consider the chart patterns and divergence in related time frames. For instance, daily divergence can be seen with weekly and monthly chart patterns, while weekly divergence tends to appear with quarterly and yearly chart patterns. Since the divergence signal does not provide the trade entry point and the target price, traders use the trading techniques provided by the accompanying technical patterns or signals.
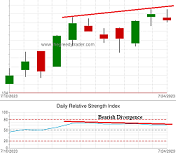
The following Campbell Soup Company (CPB) chart shows a weekly MACD bearish divergence Class B formed by a yearly Ascending Triangle chart pattern.
|
 |
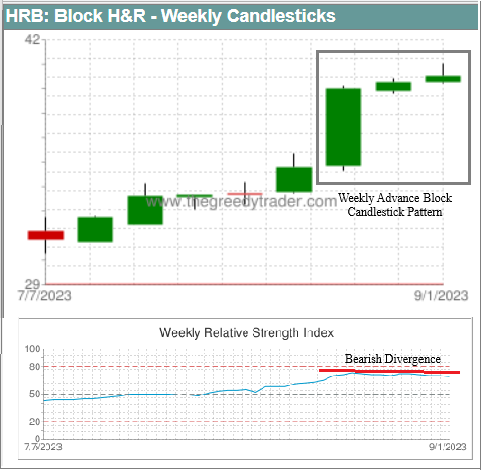
In addition to the chart patterns, divergence can often be accompanied by other technical signals, such as support and resistance lines or candlestick patterns. The H&R Block (HRB) price chart below shows an example of a weekly Relative Strength Index (RSI) bearish divergence formed by a weekly Advance Block candlestick pattern
|
 |
Bullish and Bearish Divergences Examples
|
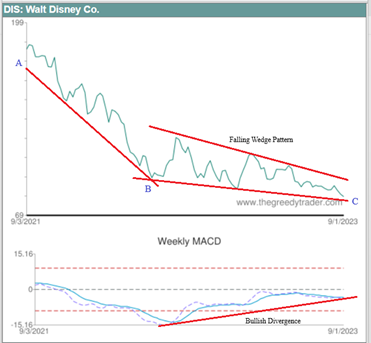
The following Walt Disney Co (DIS) price chart shows an example of a MACD bullish divergence on a weekly time frame. While the price trend is still down and making lower lows, the weekly MACD is rising and making higher lows. As explained before, a bullish divergence occurs in a falling trend when the price decline speed is slowing down. The slope of the trend support line AB on the first section of the chart is much steeper than the slope of the BC support line on the second section of the chart. The rising weekly MACD line indicates that the current downtrend is slowing down and presents a bullish divergence signal as a warning that the falling trend may reverse soon. In addition, the chart is forming a Falling Wedge pattern, which is a bullish signal as well and often accompanies a bullish divergence.
|
 |
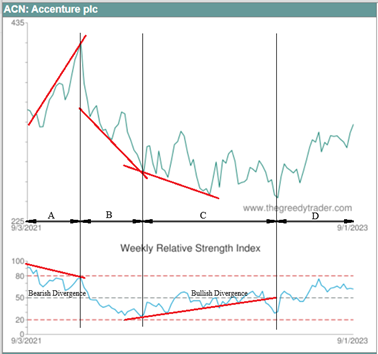
The next image is an Accenture plc (ACN) weekly price chart. On the left section of the chart (A), the weekly Relative Strength Index (RSI) has a bearish divergence, since it is making lower highs while the ACN price is still in an uptrend and making higher highs. The bearish divergence was a warning signal that predicted a trend reversal. The second (B) section of the chart shows a sharp price decline at the beginning of a new weekly downtrend. The downtrend continues in the next third section © of the chart, but at a much slower speed. The slower price movement forms a bullish divergence on the weekly Relative Strength Index. It presents a warning signal that the current downtrend is weakening and that a trend reversal may come soon. After retesting the previous low, the ACN price downtrend reverses and a new rising trend begins (see section D on the chart).
|
 |


|