GFI columns – daily and weekly Greed/Fear Indicator (Green font – oversold alert,
bold green – strong oversold, red – overbought, bold red – strong overbought).
Qscillators columns – "Daily" and "Weekly" columns show technical indicators
alerts icon. An icon has three vertical bars. From left to right they represent
Relative Strength Index (RSI), Williams' Percentage Range (W%R) and Lane's
Stochastic (%D–Slow).
– Short yellow bar represents neutral (no alerts) indicator
– Medium green bar – oversold alert
– High green bar – strong oversold alert
– Medium red bar – overbought alert
– High red bar – strong overbought alert
icon with the red border represents a bearish divergence alert and green border
– bullish divergence. To see detailed information for technical indicators and
divergence, place the cursor over the icon. A tool tip popup window will come up.
Click on the icon to see detailed technical indicators and divergence information
in a separate window.
Trend Analysis columns 
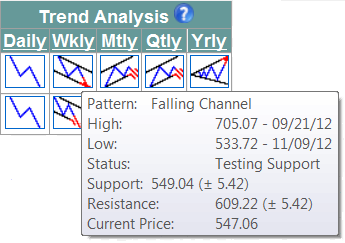
– daily, weekly, monthly, quarterly, and yearly
trends details are presented by trend alert icons. An icon indicates trend pattern
and status (valid, testing trend support, testing trend resistance, broken
trend support, broken trend resistance). To see detailed trend analysis
information, place the cursor over the icon. A tool tip popup window will come
up. Click on the icon to see detailed trend analysis information in separate
window.
Ranking columns –"Sector" and "Industry" columns represent Sector and
Industry Rank. Sectors are ranked from 1 to 10 with higher number represents
more overbought sector. The industries are ranked from 1 to 216 in the same way. The
rank can be used for sector and industry rotation.
Alerts column – represents system alerts (downtrend exhaustion, downtrend
broken resistance, uptrend support, uptrend exhaustion, uptrend broken support,
downtrend resistance). An alert rank is represented by stars.
|