Stock Market Trend Analysis Newsletter.
|
|
Weekly Market Overview - 08/28/2020Weekly Stock Market Overview
(August 29, 2020)
|
Major US indices |
It was an up week for the major U.S. indices. All three major US indices have a strongly overbought monthly, weekly, and daily Williams' Percentage Range (W%R) and strongly overbought daily Lane's Stochastic.
| S&P 500 Trend Analysis: |
This week, the S&P 500 (^GSPC) was up 110.85 points, or 3.26%, and closed at 3508.01. ^GSPC closed positive for the fifth consecutive week. The ^GSPC price is above the Upper Bollinger Band, and it rises above Parabolic SAR.
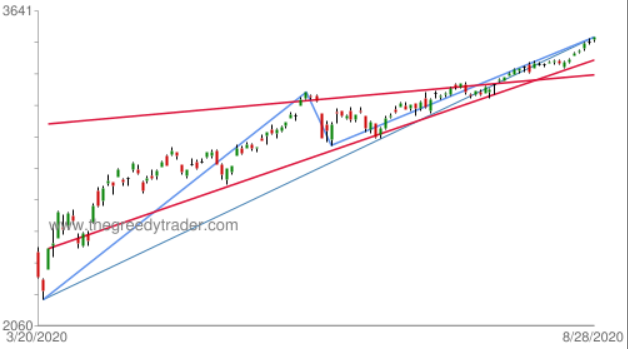
The S&P 500 monthly uptrend started on March 06, 2009 at 666.79 and reached 3,509.23 on August 28, 2020, making a 426.29% gain in twelve years. The monthly uptrend started on March 23, 2020 at 2,191.86 and reached 3,509.23 on August 28, 2020, making a 60.10% gain in twenty two weeks.
Almost 10% of S&P 500 component stocks have strongly overbought weekly Lane's Stochastic. It is the highest level since January 24, 2020. The number of the S&P 500 component stocks that currently have weekly Relative Strength Index (RSI) bearish divergence is at the highest level since February 21, 2020.
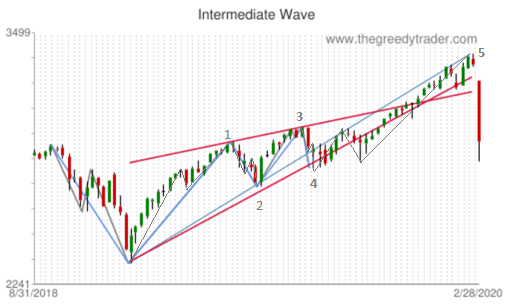
The chart on the left below shows the S&P 500 monthly Wave structure that has formed an extended Rising Wedge chart pattern. For comparison, the chart below on the right shows similar pattern formed just prior the February 19 downturn that started at 3,393.52 and reached 2,191.86 on March 23, 2020, making 35.41% drop in three weeks.
|
| ^GSPC: S&P 500 |
 |
 |
|
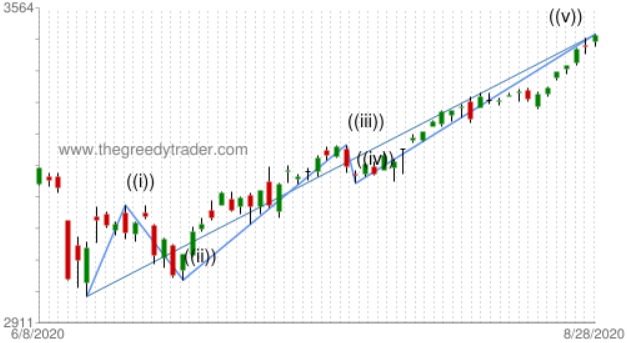
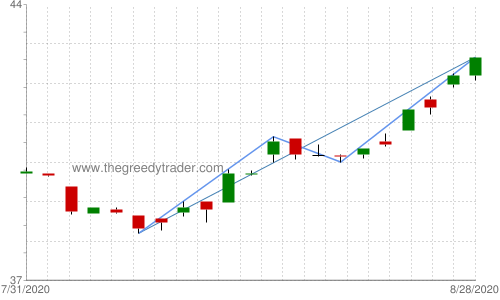
The S&P 500 weekly sub-wave has formed the Elliott Wave Impulse Wave pattern. It started on June 15, 2020 at 2,965.66 and reached 3,509.23 on August 28, 2020, making 18.33% gain.
|
| ^GSPC: S&P 500 |
|
|
The Impulse Wave pattern looks completed, and chances of the trend reversal are high.
| NASDAQ Composite Index (^IXIC) |
It was the fifth consecutive positive week for the NASDAQ Composite Index (^IXIC). The ^IXIC price jumped 383.83 points (3.39%). Williams' Percentage Range and Lane's Stochastic are strongly overbought in monthly, weekly, and daily time frames and has bearish divergence in weekly and daily time frames.
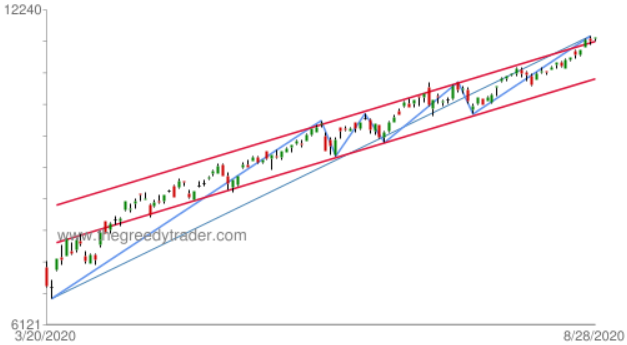
The NASDAQ Composite Index quarterly uptrend started on March 23, 2020 at 6,631.42 and reached 11,730.01 on August 27, 2020, making a 76.89% increase in twenty two weeks. Wave has formed the Rising Channel chart pattern, and price is near the resistance level.
|
| NASDAQ Composite Index (^IXIC) |
|
|
ETF's Currency Shares Alert |
This week, the CurrencyShares Swiss Franc Trust (FXF) climbed 0.78 points and closed at 101.17. The CurrencyShares Swiss Franc Trust weekly uptrend started on April 06, 2020 at 93.90 and reached 101.56 on August 18, 2020, making a 8.16% gain in nineteen weeks.
The FXF price is above the Upper Bollinger Band and above the 20 and 50 Day Moving Averages. The price rises above Parabolic SAR. Relative Strength Index and Williams' Percentage Range are strongly overbought in a weekly time frame.
| ETF's Commodity Alert |
During the past week, iPath Dow Jones AIG-Grains ETN (JJG) jumped 2.32 points, or 5.75%, and closed at 42.66.
The iPath Dow Jones AIG-Grains ETN weekly uptrend started on August 07, 2020 at 38.20 and reached 42.66 on August 28, 2020, making a 11.68% gain in fifteen business days.
|
| iPath Dow Jones AIG-Grains ETN (JJG) |
|
|
It was the biggest gain since June 2019. The volume was 14% above average. The price crossed above the 200 Day Moving Average, and it is above the 20 and 50 Day Moving Averages. Williams' Percentage Range is strongly overbought in a weekly time frame and overbought in a daily time frame. Lane's Stochastic is strongly overbought in a daily time frame and oversold in a monthly time frame.
|
S&P 500 Sector Rotation |
The Technology sector was the strongest sector last week (4.43%), followed by the Financial sector (4.32%). The Utilities sector was the worst performing sector of the week (-0.59%), followed by the Health Care sector (1.10%).
The Information Technology sector is the most overvalued sector, followed by Communication Services, while Electronic Components, Publishing, and Interactive Media & Services are among the most overvalued industries. The Energy sector is the most oversold sector, followed by Utilities, while Oil & Gas Drilling, Oil & Gas Refining & Marketing, and Integrated Oil & Gas are among the most oversold industries.
Currently the most oversold Utilities sector is one of the three Defensive sectors. The defensive stocks tend to maintain their earnings and revenues during market downturns and usually perform better during a market correction or a bear market accompanied by a recession. According to the news, Warren Buffett?s Berkshire recently spent $4 billion to buy the Dominion Energy that belongs to the Utilities sector and Utilities - Diversified Industry.
|
|
|
|
|
|
|
|
|
|
|
|
|
|
|
|
|
|
|
|
|
|
|
|
|
|
|
|
NASDAQ biggest weekly advance
|
|
It was the biggest weekly NASDAQ advance recorded. More than 30% of S&P members are trading at their highest price in the past 52 weeks.
|
|
Jan
7 ,
2018
|
|
|
Eighth consecutive positive week
|
|
It was the eighth consecutive positive week for S&P 500 index. More than 40% of S&P 500 component stocks have overbought weekly Lane's Stochastic. It is the highest level since April 29, 2016.
|
|
Nov
5 ,
2017
|
|
|
ETF's Currency Shares Alert.
|
|
CurrencyShares Swedish Krona Trust (FXS) weekly downtrend reached 116.62 on September 27, making the biggest weekly drop since October 2015.
|
|
Sep
24,
2017
|
|
|
|
|
|
|
|
|
Dow Jones is near 200 Day Moving Average
|
|
During the past week, Dow Jones Industrial Average sank 507.65 points or 2.87%, to 17164.95. Williams' Percentage Range and Lane's Stochastic are overbought in a monthly time frame. The Dow Jones price is near 200 Day Moving Average.
|
|
Feb
1 ,
2015
|
|
|
|
|
|
|
The short-term rally is over
|
|
S&P 500 index may break the support around 1100 and move down to the next support area around 1000 - 950.
|
|
Sep
5 ,
2011
|
|
|
|
|
|
|
|
|
|
|
S&P 500 members - Trend Support Alert
|
|
Daily and weekly indicators are oversold for all three major US indices. More than 28% of S&P members are oversold, and more than 22% have a Trend Support Alert.
|
|
Jul
4 ,
2010
|
|
|
|
|
S&P 500 members - uptrend support alert
|
|
More than 30% of S&P 500 members have an uptrend support alert. This alert indicates that stock price is near the monthly uptrend support level.
|
|
May
23,
2010
|
|
|
Dow Jones Elliott Wave count
|
|
Dow Jones gained 68.03% in 53 weeks. The chart has formed a Rising Channel chart pattern. Fifth wave up is in progress.
|
|
Mar
21,
2010
|
|
|
|
|
|
|

|
This work is available under the terms of the
Creative
Commons Attribution-NoDerivs 2.5 License.
|
|