Stock Market Trend Analysis Newsletter.
|
|
Weekly Market Overview - 14/28/2020Weekly Stock Market Overview
(March 20, 2020) |
S&P 500 index
|
During the past week, Dow Jones lost 17.3%, the S&P 500 - 14.9%, and NASDAQ - 12.64%. Once again all three major U.S. indices suffered the biggest weekly loss since October 10, 2008 when S&P 500 had lost more than 18.2% in one week. While usually NASDAQ is more volatile than S&P and Dow Jones, the technology companies now show more resilience than other sectors, since virus does not affect technologies as much as the industries that require intense human interactions.
All three major US indices have an oversold weekly Williams' Percentage Range (W%R) and oversold daily Lane's Stochastic, while monthly Lane's Stochastic is still overbought.
| S&P 500 Trend Analysis: |
In our previous S&P 500 Cycle Trend Analysis, published on March 13, 2020, we suggested:
Considering how sharp was the weekly downtrend, the breaking channel support scenario has more chances. In this case, as you can see from the chart, the next support level is at 2346.58 that marks 30.85% decline from recent high.
| | ^GSPC: S&P 500 | 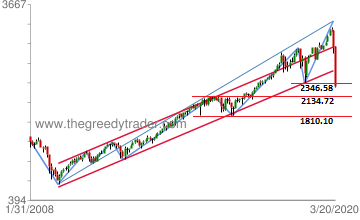
|
|
During the week, S&P 500 price has bounced several days around the 2346.58 support level, and it closed the week below this level. The next support level is at 2134.72.
The current S&P 500 down trend started on February 19, 2020 at 3393.52 and reached 2280.52 on Wednesday, March 18, losing 32.8&%. The wave is moving in a falling channel and has formed a five sub-waves structure that represents the Elliot Waves impulse wave pattern. According to Elliott Wave theory, the impulse wave appears in a strong trend and has the same direction as the main trend; it is usually followed by three sub-waves correction structure in the opposite direction.
| | ^GSPC: S&P 500 | 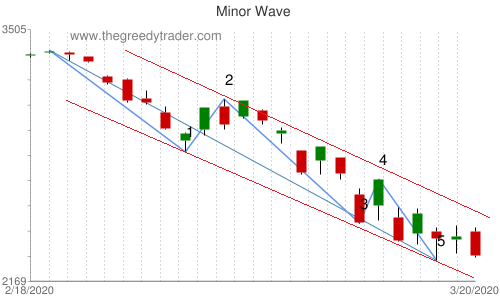
|
|
The fifth sub-wave of the Elliott Wave impulse pattern might not be over yet, but the oversold daily and weekly stochastic indicators show that it might be completed soon. The completion of the impulse pattern can be confirmed only when price will break the falling channel resistance trend line.
Following is the list of some bullish and bearish technical signals:
Bearish signals:
- overbought monthly Lane's Stochastic
- falling channel chart pattern
Bullish signals:
oversold weekly Williams' Percentage Range (W%R)
- oversold daily Lane's Stochastic
- Nasdaq daily MACD and Lane's Stochastic bullish divergence
- Elliott Wave impulse wave structure almost completed
As you can see, there are more bullish technical signals than bearish, but all bullish signals are short-term, while bearish signals are in the longer time frame.
|
The Best Trading Strategies for the Trending Market |
Since February 19, 2020 the market is in distinct downward trend. There are trading strategies that work best in trending market. Some of them use the trend following indicators.
| Moving Average |
The Moving Average is one of the trend following indicators that works pretty well in trending market, but gives a lot of noise in ranging market (when the price moves in a range). When the stock price crosses above the Moving Average, it generates a buy signal, and when the price crosses below Moving Average, it generates a sell signal.
The chart S&P 500 index below shows how to use 200 Day Moving Average. The strategy generated a buy signal on June 28, 20016 when ^GSPC closed at 2036.09 above 200 MA (2021.42). The sell signal was generated on April 2, 2018 when S&P 500 closed at 2581.88 below 200 MA (2589.85). This trade made more than 26% gain in 20 month.
| | ^GSPC: S&P 500 | 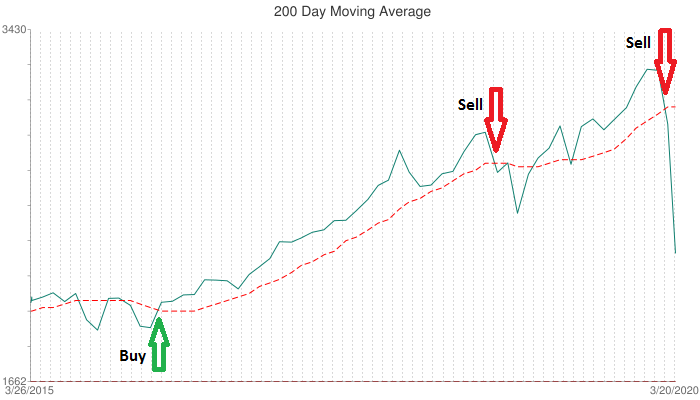 |
|
On March 4, 2020, the price crossed below 200 Day Moving Average generating the latest sell signal. The next buy signal will be generated when the price crosses above the 200 MA line.
The Moving Average is the lagging indicator, and it gives the signals only after the substantial price change. In order to get more sensitive signals, you can use less number of days for the moving average.
Below is the S&P 500 chart with 20 Day Moving Average. 20 MA generated a sell signal on February 21, just two days after the start of the market downtrend. Usually 20 MA strategy is very sensitive, and in a ranging market it generates a lot of noise, but it works very well when there is a steep-slope trend.
| | ^GSPC: S&P 500 | 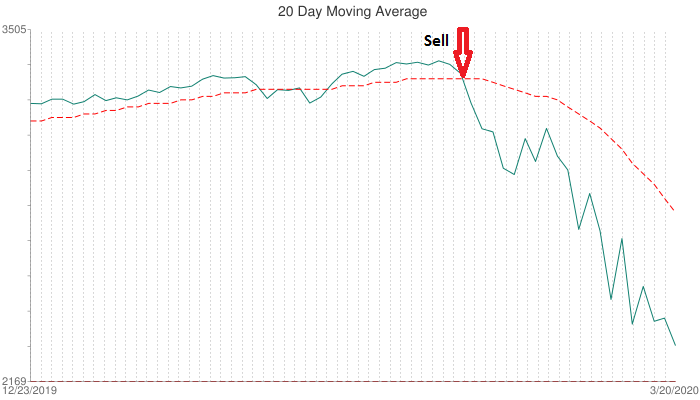
|
| Parabolic SAR |
Parabolic SAR is another strategy that uses trend following signals. The chart below presents Nasdaq (^IXIC ) Parabolic SAR buy/sell signals. Similar to the Moving Average indicator, the by signal is generated when the stock price crosses above the Parabolic SAR line, and a sell signal is generated when the price crosses below the Parabolic SAR line. The left part of the chart below represents the ranging market, while the right part represents the strong trending market. You can see that Parabolic SAR signals in the trending market are much more profitable than in ranging market. The latest sell signal was generated on March 5 at 8738.59 and a buy signal was generated on Friday, March 20 at 6879.52. This trade made more than 26% gain in 20 month.
| | ^IXIC: Nasdaq | 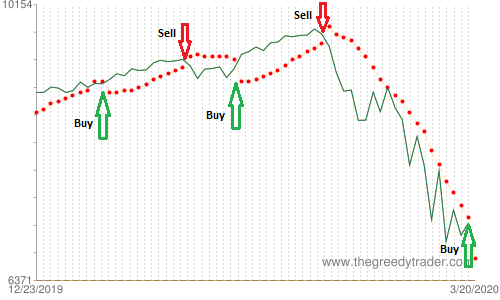
|
|
The Technical Stock Screener provides the list of trend following signals:
- Price Crossed Above 50 Day Moving Average
- Price Crossed Below 50 Day Moving Average
- Price bounced up off 50 Day Moving Average
- Price bounced down off 50 Day Moving Average
- Price Rises Above Parabolic SAR
- Price Falls Below Parabolic SAR
- Daily Golden Cross
- Weekly Golden Cross
- Monthly Golden Cross
- Quarterly Golden Cross
- Daily Death Cross
- Weekly Death Cross
- Monthly Death Cross
- Quarterly Death Cross
This page also provides a weekly list of S&P 500 stocks that generated above trading signals.
|
ETF's Indices Alert |
During the past week, CurrencyShares Australian Dollar Trust (FXA) fell 4.40 points and closed at 58. The volume was 97% above average. The weekly volatility was 489% above average. The daily Lane's Stochastic main line (K%) crossed above the oversold signal line (D%). The FXA price is below the 20 and 50 Day Moving Averages. Technical indicators are oversold in monthly, weekly, and daily time frames and have bullish divergence.
| | FXA: CurrencyShares Australian Dollar Trust | 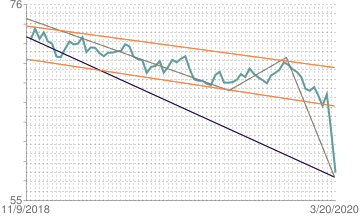
|
|
S&P 500 Sector Rotation | The Consumer Staples sector was the most resilient sector last week (-10.97%), followed by the Materials sector (-12.53%). The Energy sector was the worst performing sector of the week (-19.66%), followed by the Industrial sector (-18.33%).
The Healthcare sector is the most overvalued sector, followed by Utilities, while Biotechnology, Specialized Health Svcs, and Diversified Utilities are among the most overvalued industries. The Basic Materials sector is the most oversold sector, followed by Services, while General Entertainment, Oil & Gas Equipment/Svcs, and Aluminum are among the most oversold industries.
|
|
|
|
|
|
|
|
|
|
|
|
|
|
|
|
|
|
|
|
|
|
|
|
|
|
|
|
NASDAQ biggest weekly advance
|
|
It was the biggest weekly NASDAQ advance recorded. More than 30% of S&P members are trading at their highest price in the past 52 weeks.
|
|
Jan
7 ,
2018
|
|
|
Eighth consecutive positive week
|
|
It was the eighth consecutive positive week for S&P 500 index. More than 40% of S&P 500 component stocks have overbought weekly Lane's Stochastic. It is the highest level since April 29, 2016.
|
|
Nov
5 ,
2017
|
|
|
ETF's Currency Shares Alert.
|
|
CurrencyShares Swedish Krona Trust (FXS) weekly downtrend reached 116.62 on September 27, making the biggest weekly drop since October 2015.
|
|
Sep
24,
2017
|
|
|
|
|
|
|
|
|
Dow Jones is near 200 Day Moving Average
|
|
During the past week, Dow Jones Industrial Average sank 507.65 points or 2.87%, to 17164.95. Williams' Percentage Range and Lane's Stochastic are overbought in a monthly time frame. The Dow Jones price is near 200 Day Moving Average.
|
|
Feb
1 ,
2015
|
|
|
|
|
|
|
The short-term rally is over
|
|
S&P 500 index may break the support around 1100 and move down to the next support area around 1000 - 950.
|
|
Sep
5 ,
2011
|
|
|
|
|
|
|
|
|
|
|
S&P 500 members - Trend Support Alert
|
|
Daily and weekly indicators are oversold for all three major US indices. More than 28% of S&P members are oversold, and more than 22% have a Trend Support Alert.
|
|
Jul
4 ,
2010
|
|
|
|
|
S&P 500 members - uptrend support alert
|
|
More than 30% of S&P 500 members have an uptrend support alert. This alert indicates that stock price is near the monthly uptrend support level.
|
|
May
23,
2010
|
|
|
Dow Jones Elliott Wave count
|
|
Dow Jones gained 68.03% in 53 weeks. The chart has formed a Rising Channel chart pattern. Fifth wave up is in progress.
|
|
Mar
21,
2010
|
|
|
|
|
|
|

|
This work is available under the terms of the
Creative
Commons Attribution-NoDerivs 2.5 License.
|
|